Italy of the second lockdown: -31% in offices

Google Mobility Report
One of the most striking data relates to travel to places of leisure ("bars, restaurants, shopping centers, museums, cinemas, libraries" ): in Italy in general it has reached -40% in recent days compared to previous months, thus signing a substantial decrease. This was exactly the effect we wanted to achieve with the different gradations of closure on the national territory: to reduce the opportunities for meeting and collective relaxation, as a certain source of opportunities for risk and contagion.Another important number recorded is related to the movements to the parks, finally collapsed after an excessive enthusiasm linked to the desire for open spaces in this warm early autumn. The definition of the red areas prevented travel other than for real physical activity, thus bringing outdoor presences to -19%.
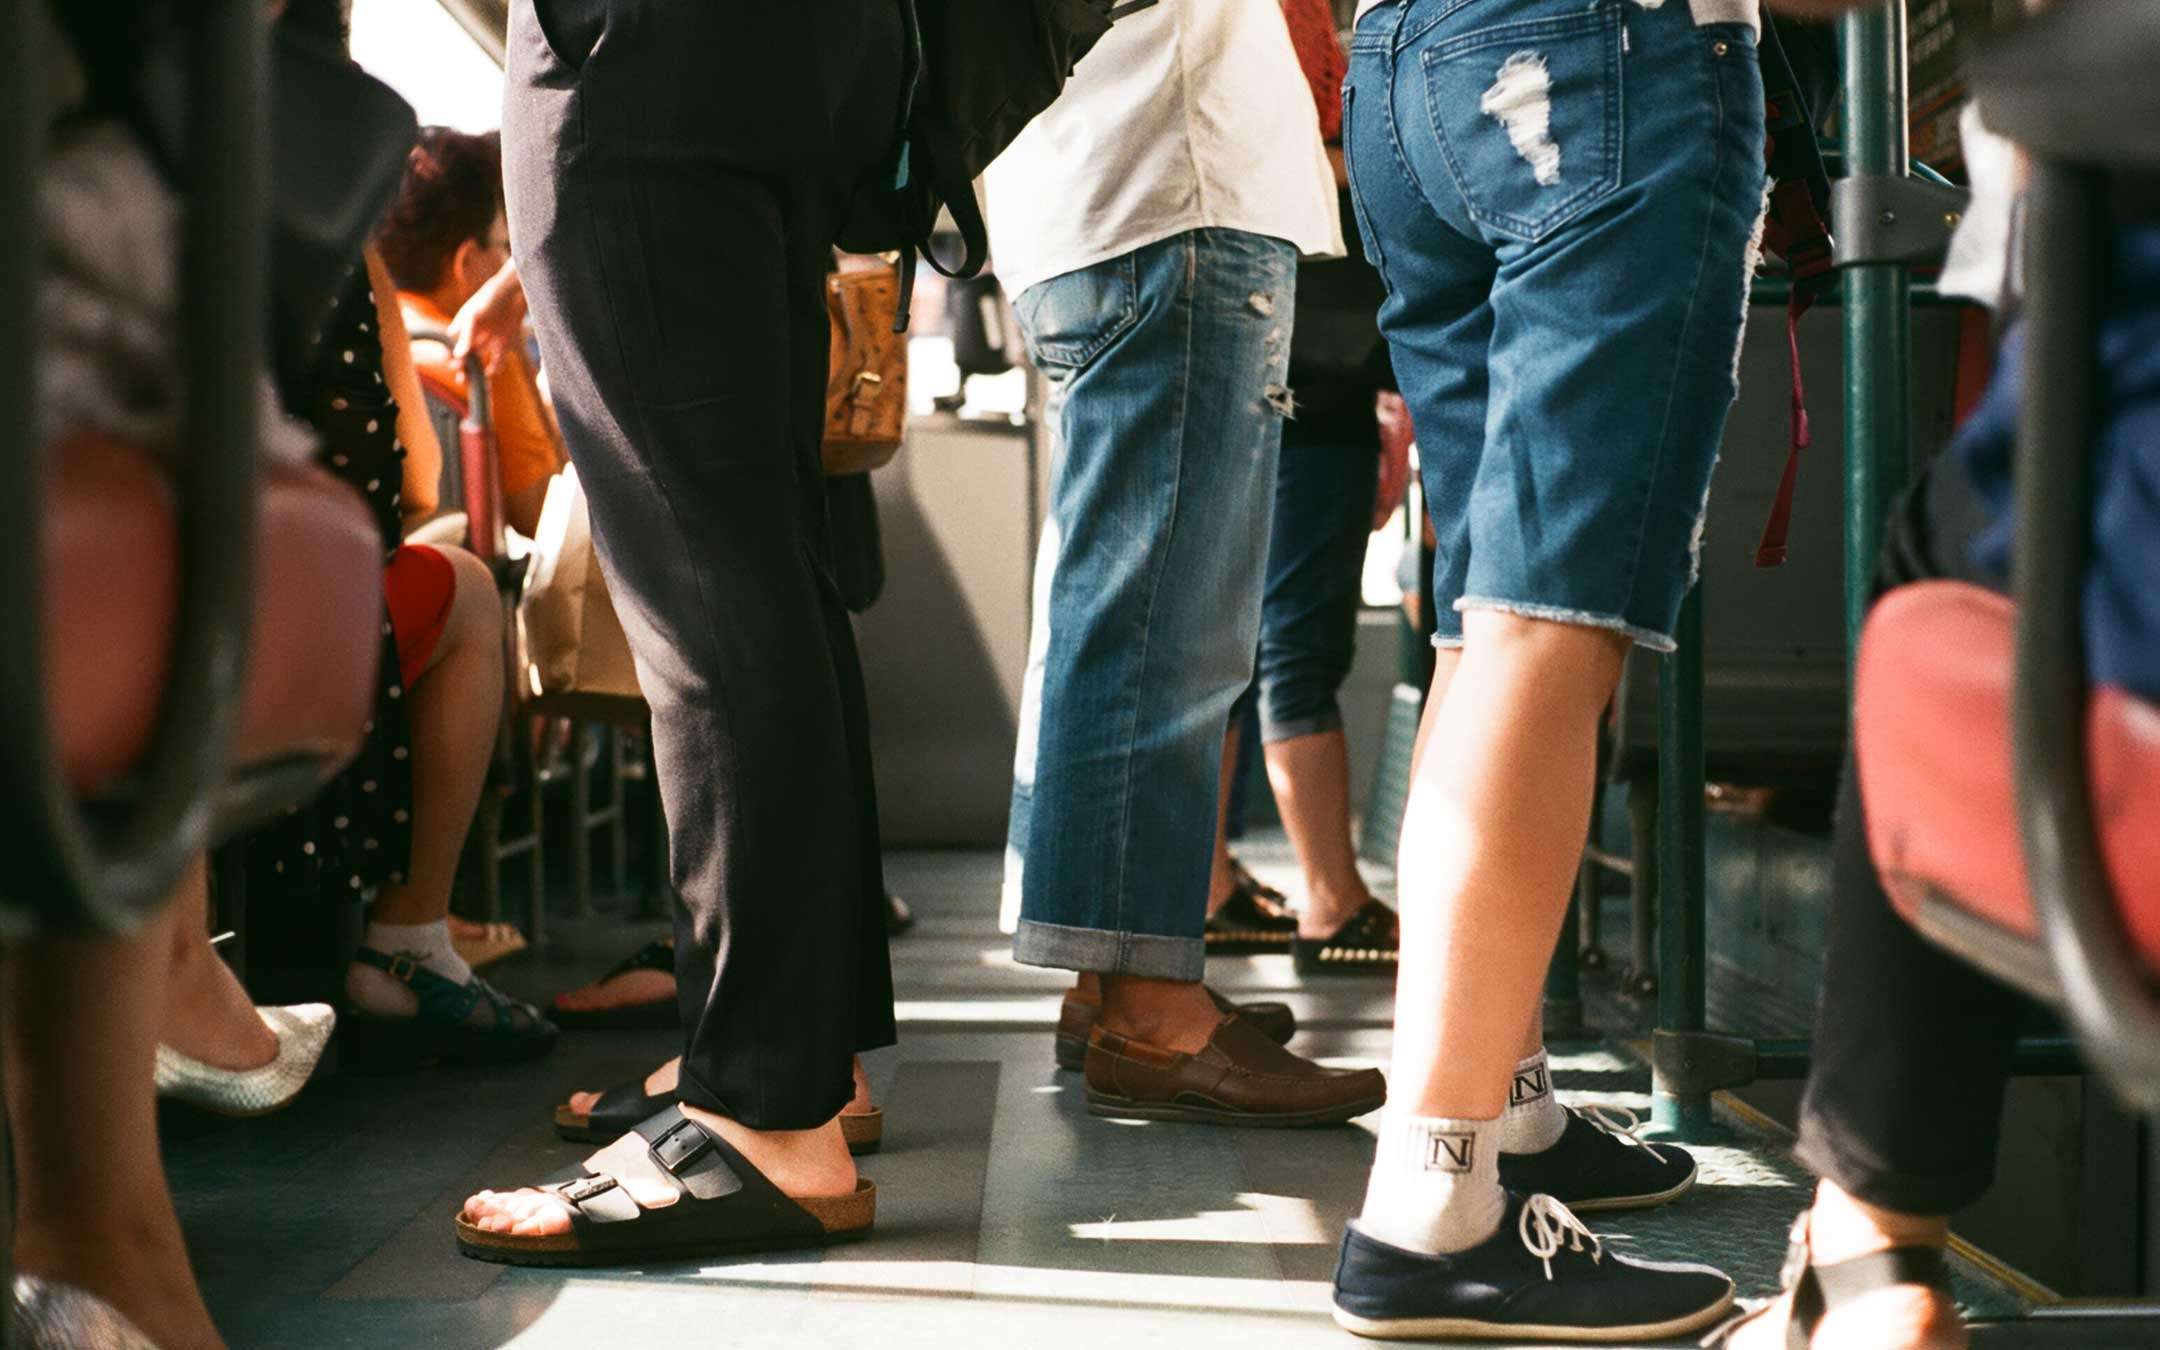
The most important graph is that relating to attendance at public transport stations (buses or subways), places of serious risk for infections by virtue of the crowding of many in small spaces. The data indicate a 47% decrease in presences in these places, as well as a 31% decrease in the presence in the workplace and a 15% increase in residential areas.
Red zone effect
Confirmed trends, but numbers that are progressively increasing with the increase of the "red" areas on the national territory. In the red areas, in fact, the numbers are even more striking. In Lombardy, for example, the free time spaces have seen more than half attendance, with attendance on public transport dropped by almost 60%. Permanence in residential areas reaches 19% and in workplaces it drops by 37%.These data are accompanied by those that indicate a sharply slowing pandemic curve, in a trend of deaths destined to slow down - as expected - delayed by 1-2 weeks and in the possibility that only with the month of December it will be possible to return to more sustainable numbers for national health. Everything else is economy and Christmas, but it has little to do with statistics.