Google Mobility Report: how Italy moves

The update to which you can refer to today is that of 25 October, almost contemporaneous with the entry into force of the last Prime Minister's Decree announced on TV by the Prime Minister; the next updates will go to photograph the response to the DPCM which closed bars and restaurants, which may be useful to photograph the actual response in statistical terms. This information, it should be remembered, is collected by monitoring Android devices in the area, therefore on a sufficiently large and representative catchment area.
Google Mobility Report, update of 25 October
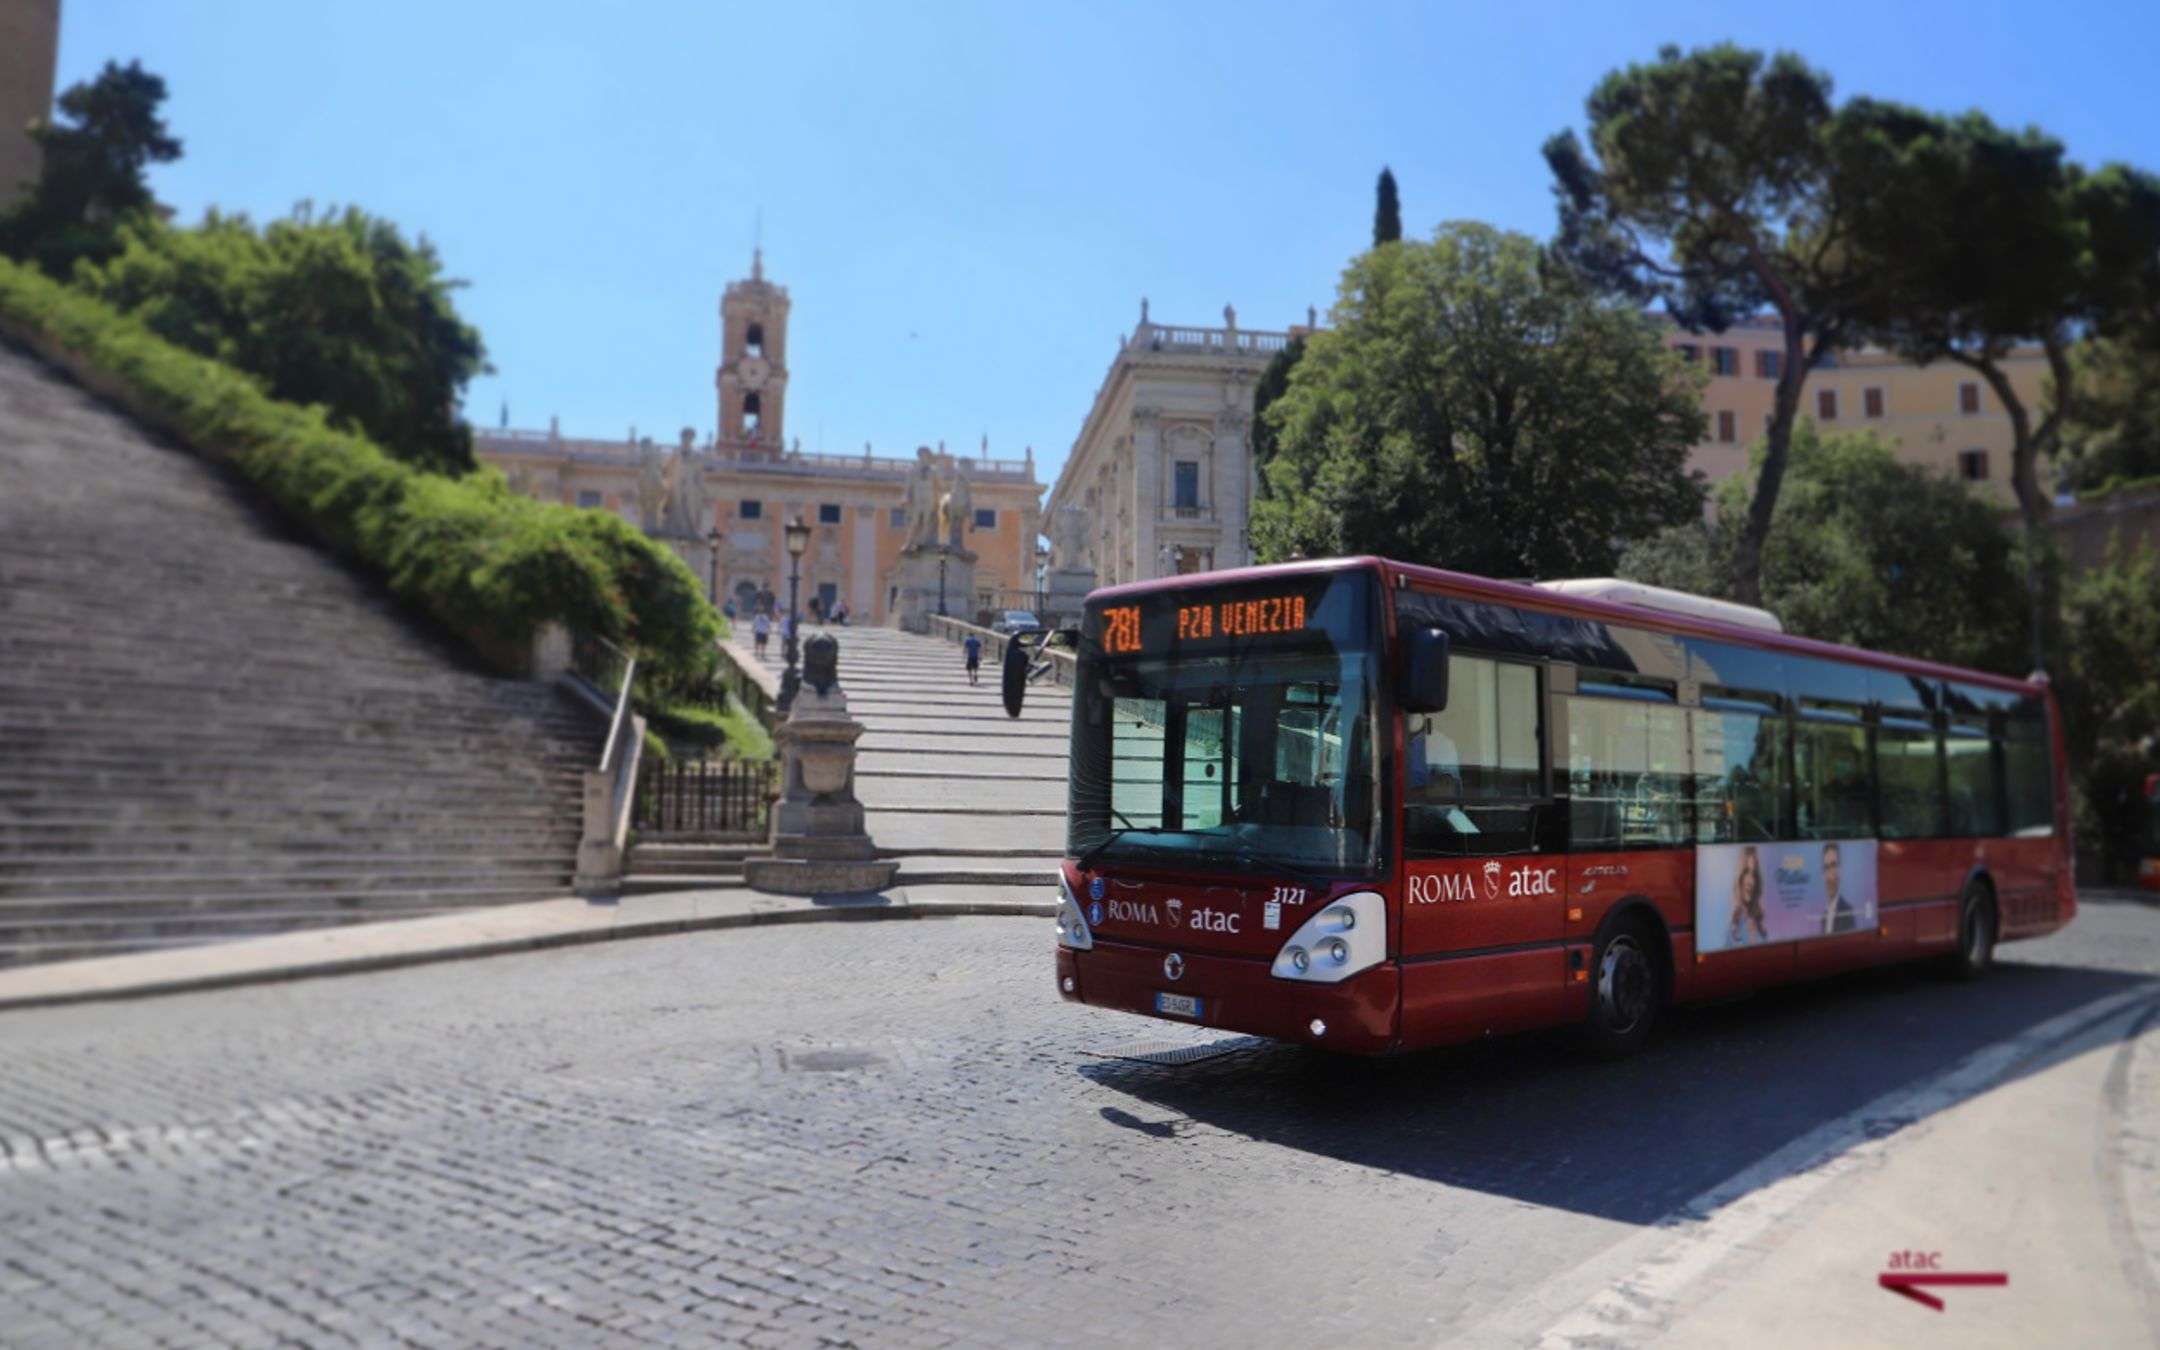
Among the more interesting information is related to free time, a context in which travel has progressively slowed down from September to today up to -28% destined to further collapse. The data is calculated on the average of the previous months, when free time was much more and with a mental approach very different from the current one.Another interesting figure is that relating to public transport, which fell by 26% in October: the perception of a return wave began to emerge only this month and with the closure of offices and schools the pressure on public transport has decreased. This figure is also destined to swell further, photographing the effects of progressive restrictions that will lead fewer people to move and therefore enter situations of objective risk.
The share of Android users who are increasing slightly (+ 5%) remain in residential areas, the number of people in the workplace decreases in parallel (-9%). These percentages, albeit minimal, probably reflect the greater use of smart working (especially by the Public Administration), but with the resurgence of the pandemic curve, these two figures are likely to follow an increasingly divergent trend with the passing of weeks.
The next update of the Google report will be interesting because it will allow us to understand how and if the DPCM has been able to affect displacements, distancing and - consequently - on the contagion curve in progress. Following the data is fundamental, because it allows you to really understand what is happening and never as in this historical period the data are available: the important thing is to be able toa> find them, to know how to read them and to avoid loading them with forced interpretations.
Source: Google Mobility Report